SwiftUI Charts 是苹果官方提供的一个用于绘制图表的组件库。
笔者在使用SwiftUI Charts 遇到了一个问题:使用Charts绘制的图表,默认文字都是灰色的,当我们app的主题颜色是固定深色的情况下(不是跟随系统的主题深色),图表的文字会看不清。
以柱形图为例,案例代码如下:
// 用于绘制图表的数据的结构体
struct BarItem: Identifiable {
    var id = UUID()
    let category: String // 多项对比,分类名称
    let name: String // x轴名称
    let value: Double // y轴值
    let color: Color
}

Chart(dataArray) { data in
	BarMark(
     x: .value("Name", data.name),
     y: .value("Value", data.value)
  )
  .foregroundStyle(data.color)
  .foregroundStyle(by: .value("Category", data.category))
  .annotation(position: .overlay) {
       Text("\\(Int(data.value))")
            .font(.caption)
            .foregroundStyle(Color.white)
   }
}.frame(maxWidth: .infinity, maxHeight: 250, alignment: .center)
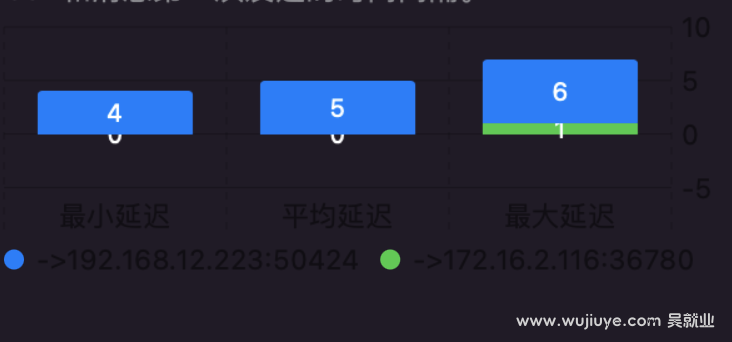
案例效果如下:

可以看到,只有柱形图上的数值的颜色是白色,其它x轴、y轴等文本字体颜色都是深色的,跟背景颜色冲突了,会看不清。
柱形图上的数值的颜色是白色的,因为是我们通过annotation函数设置的,代码如下。
.annotation(position: .overlay) {
       Text("\\(Int(data.value))")
            .font(.caption)
            .foregroundStyle(Color.white)
   }
那么怎么修改其他文字的字体颜色呢?
图表(Chart)是由很多组件组成的,首先我们需要了解我们想要修改的文本涉及图表中的哪些组件,这样才能知道怎么搜索资料。参考这篇博客文章:《ECharts 图表组成》,再根据上图理解,我们需要修改的图表组件包括:
- 坐标系组件:xAxis组件、yAxis组件。
- 图例组件(Legend)。
Legend:图例是图表的辅助视觉引导组件,用以解释说明图表中各数据序列的含义及图表中数据的筛选。
笔者从官方api文档《Customizing axes in Swift Charts》找到了相关的API。
其中xAxis组件和yAxis组件分别是使用Chart的chartXAxis和chartYAxis函数设置,通过AxisMarks来设置坐标轴显示值的Label,然后给Label设置前景色:AxisValueLabel().foregroundStyle(Color.white)。
Legend组件则通过使用Chart的chartLegend函数设置,但不同于chartXAxis和chartYAxis,调用chartLegend我们需要完全自己绘制Legend组件。在构造BarMark的时候,我们使用foregroundStyle(by: .value("Category", data.category))设置了使用category自动绘制Legend,同样的,调用chartLegend函数我们需要先获取到所有category,并且获取到category对应的color,最后通过ForEach为每个category绘制一个Label,如用category的color画一个小圈,再用Text显示category。
修改后代码如下:
struct BarItem: Identifiable {
    var id = UUID()
    let category: String
    let name: String
    let value: Double
    let color: Color
}

struct ChartLegend: Identifiable {
    var id = UUID()
    var category: String
    var color: Color
}

func getChartLegend(_ dataArray:[BarItem])-> [ChartLegend] {
	// ....
}

Chart(dataArray) { data in
	BarMark(
     x: .value("Name", data.name),
     y: .value("Value", data.value)
  )
  .foregroundStyle(data.color)
  .foregroundStyle(by: .value("Category", data.category))
  .annotation(position: .overlay) {
       Text("\\(Int(data.value))")
            .font(.caption)
            .foregroundStyle(Color.white)
   }
}.frame(maxWidth: .infinity, maxHeight: 250, alignment: .center)
	.chartYAxis {
       AxisMarks(
          values: [0, 2, 4, 6, 8, 10] // Y轴坐标的取值
       ) {
           AxisValueLabel().foregroundStyle(Color.white)
       }
   }
   .chartXAxis {
        AxisMarks {
            AxisValueLabel().foregroundStyle(Color.white)
        }
   }
   .chartLegend(position: .bottom, alignment: .bottomLeading, spacing: 8, content: {
        HStack{
             ForEach(getChartLegend(dataArray)) { item in
                  Label(
                       title: {
                           Text("\\(item.category)").font(.caption).foregroundStyle(Color.white)
                       },
                       icon: {
                            Circle().fill(item.color).frame(width: 8, height: 8)
                       }
                  )
             }
       }.frame(maxWidth: .infinity, alignment: .leading)
  })
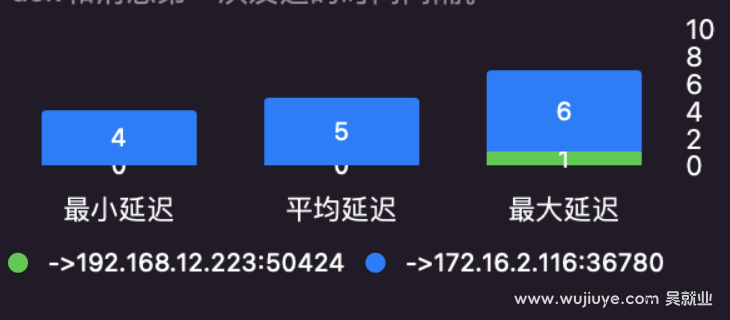
修改后的效果如下:

参考文献: